Requirement already satisfied: openpyxl in d:\program files\python3.12.7\lib\site-packages (3.1.5)
Requirement already satisfied: et-xmlfile in d:\program files\python3.12.7\lib\site-packages (from openpyxl) (2.0.0)
Note: you may need to restart the kernel to use updated packages.
[notice] A new release of pip is available: 24.2 -> 24.3.1
[notice] To update, run: python.exe -m pip install --upgrade pip
import pandas as pdimport matplotlib as mplimport matplotlib.pyplot as pltimport numpy as npfrom pathlib import Pathimport pingouin as pgfrom lets_plot import*LetsPlot.setup_html(no_js=True)### You don't need to use these settings yourself### — they are just here to make the book look nicer!# Set the plot style for prettier charts:plt.style.use("https://raw.githubusercontent.com/aeturrell/core_python/main/plot_style.txt")
D:\Program Files\python3.12.7\Lib\site-packages\openpyxl\worksheet\_reader.py:329: UserWarning: Unknown extension is not supported and will be removed
  warn(msg)
test_data = {"City A": [14.1, 14.1, 13.7],"City B": [11.0, 12.6, 12.1],}# Original dataframetest_df = pd.DataFrame.from_dict(test_data)# A copy of the dataframetest_copy = test_df.copy()# A pointer to the dataframetest_pointer = test_dftest_pointer.iloc[1, 1] =99
C:\Users\zhangyongtian\AppData\Local\Temp\ipykernel_7132\3801786469.py:2: FutureWarning: The provided callable <function mean at 0x0000028CC7F3D260> is currently using DataFrame.mean. In a future version of pandas, the provided callable will be used directly. To keep current behavior pass the string "mean" instead.
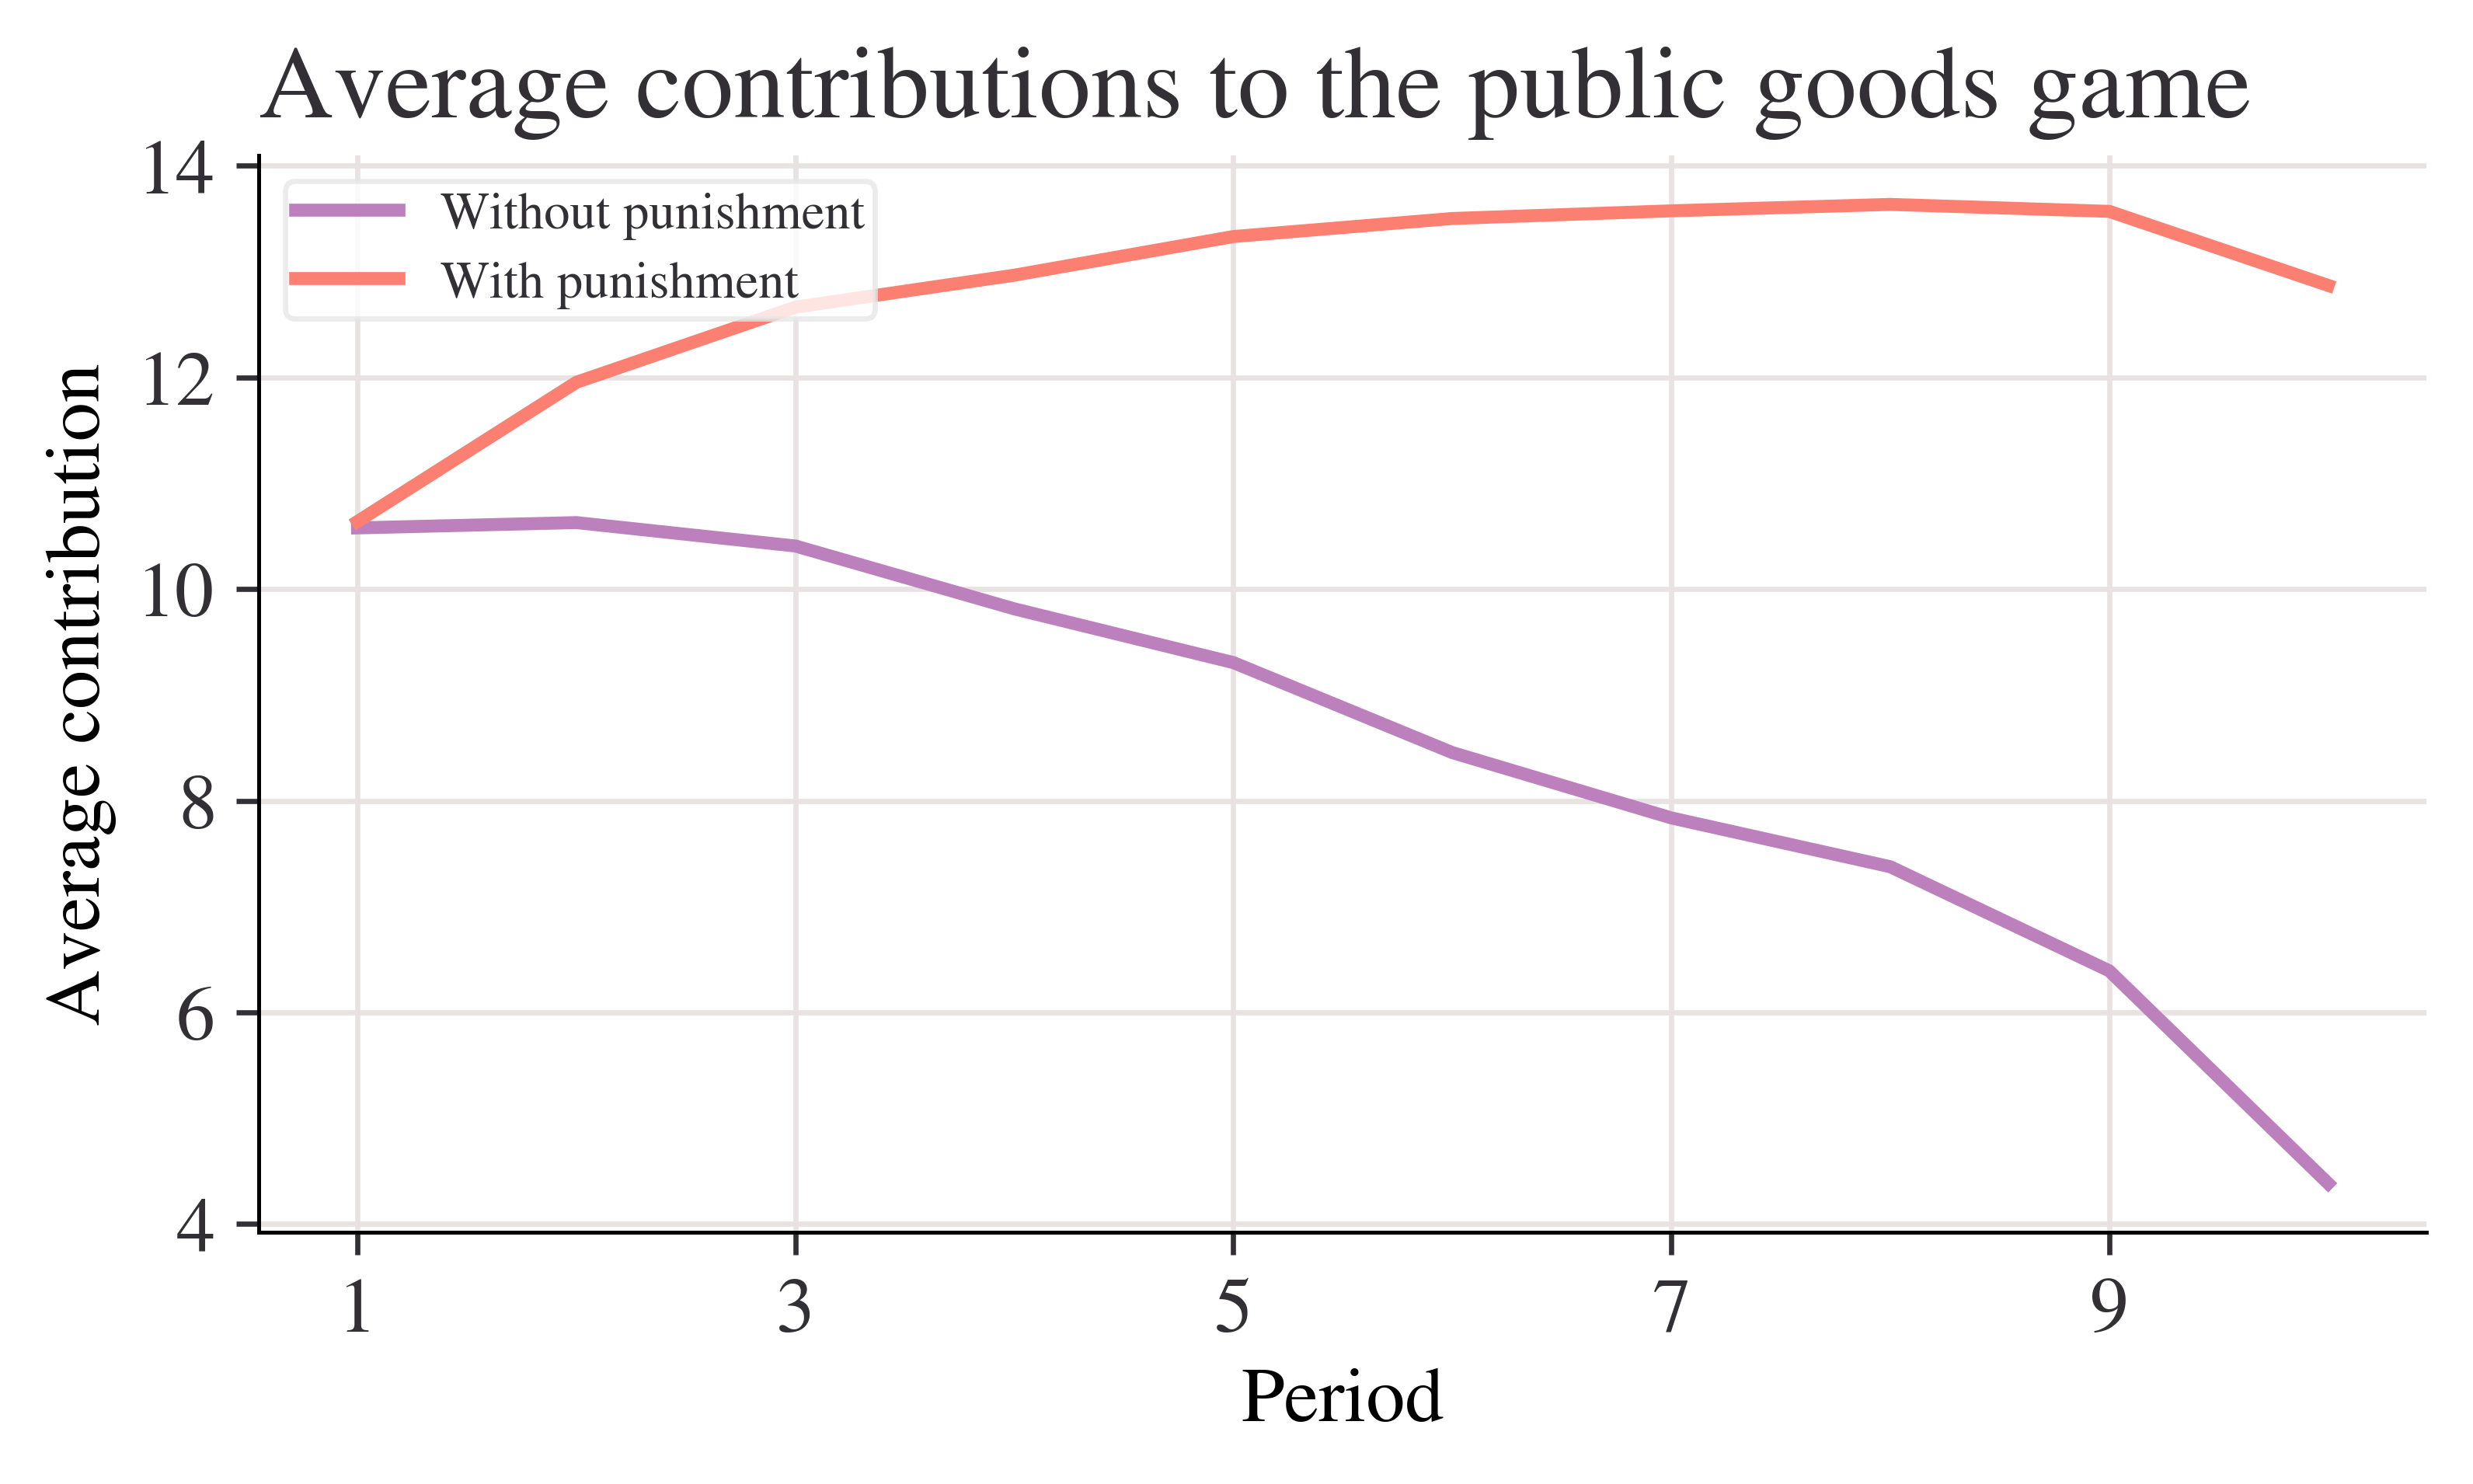
mean_p_c = data_p.agg(np.mean, axis=1)
fig, ax = plt.subplots()mean_n_c.plot(ax=ax, label="Without punishment")mean_p_c.plot(ax=ax, label="With punishment")ax.set_title("Average contributions to the public goods game")ax.set_ylabel("Average contribution")ax.legend()
partial_names_list = ["F. Kennedy", "Lennon", "Maynard Keynes", "Wayne"]["John "+ name for name in partial_names_list]
['John F. Kennedy', 'John Lennon', 'John Maynard Keynes', 'John Wayne']
['John F. Kennedy', 'John Lennon', 'John Maynard Keynes', 'John Wayne']
['John F. Kennedy', 'John Lennon', 'John Maynard Keynes', 'John Wayne']
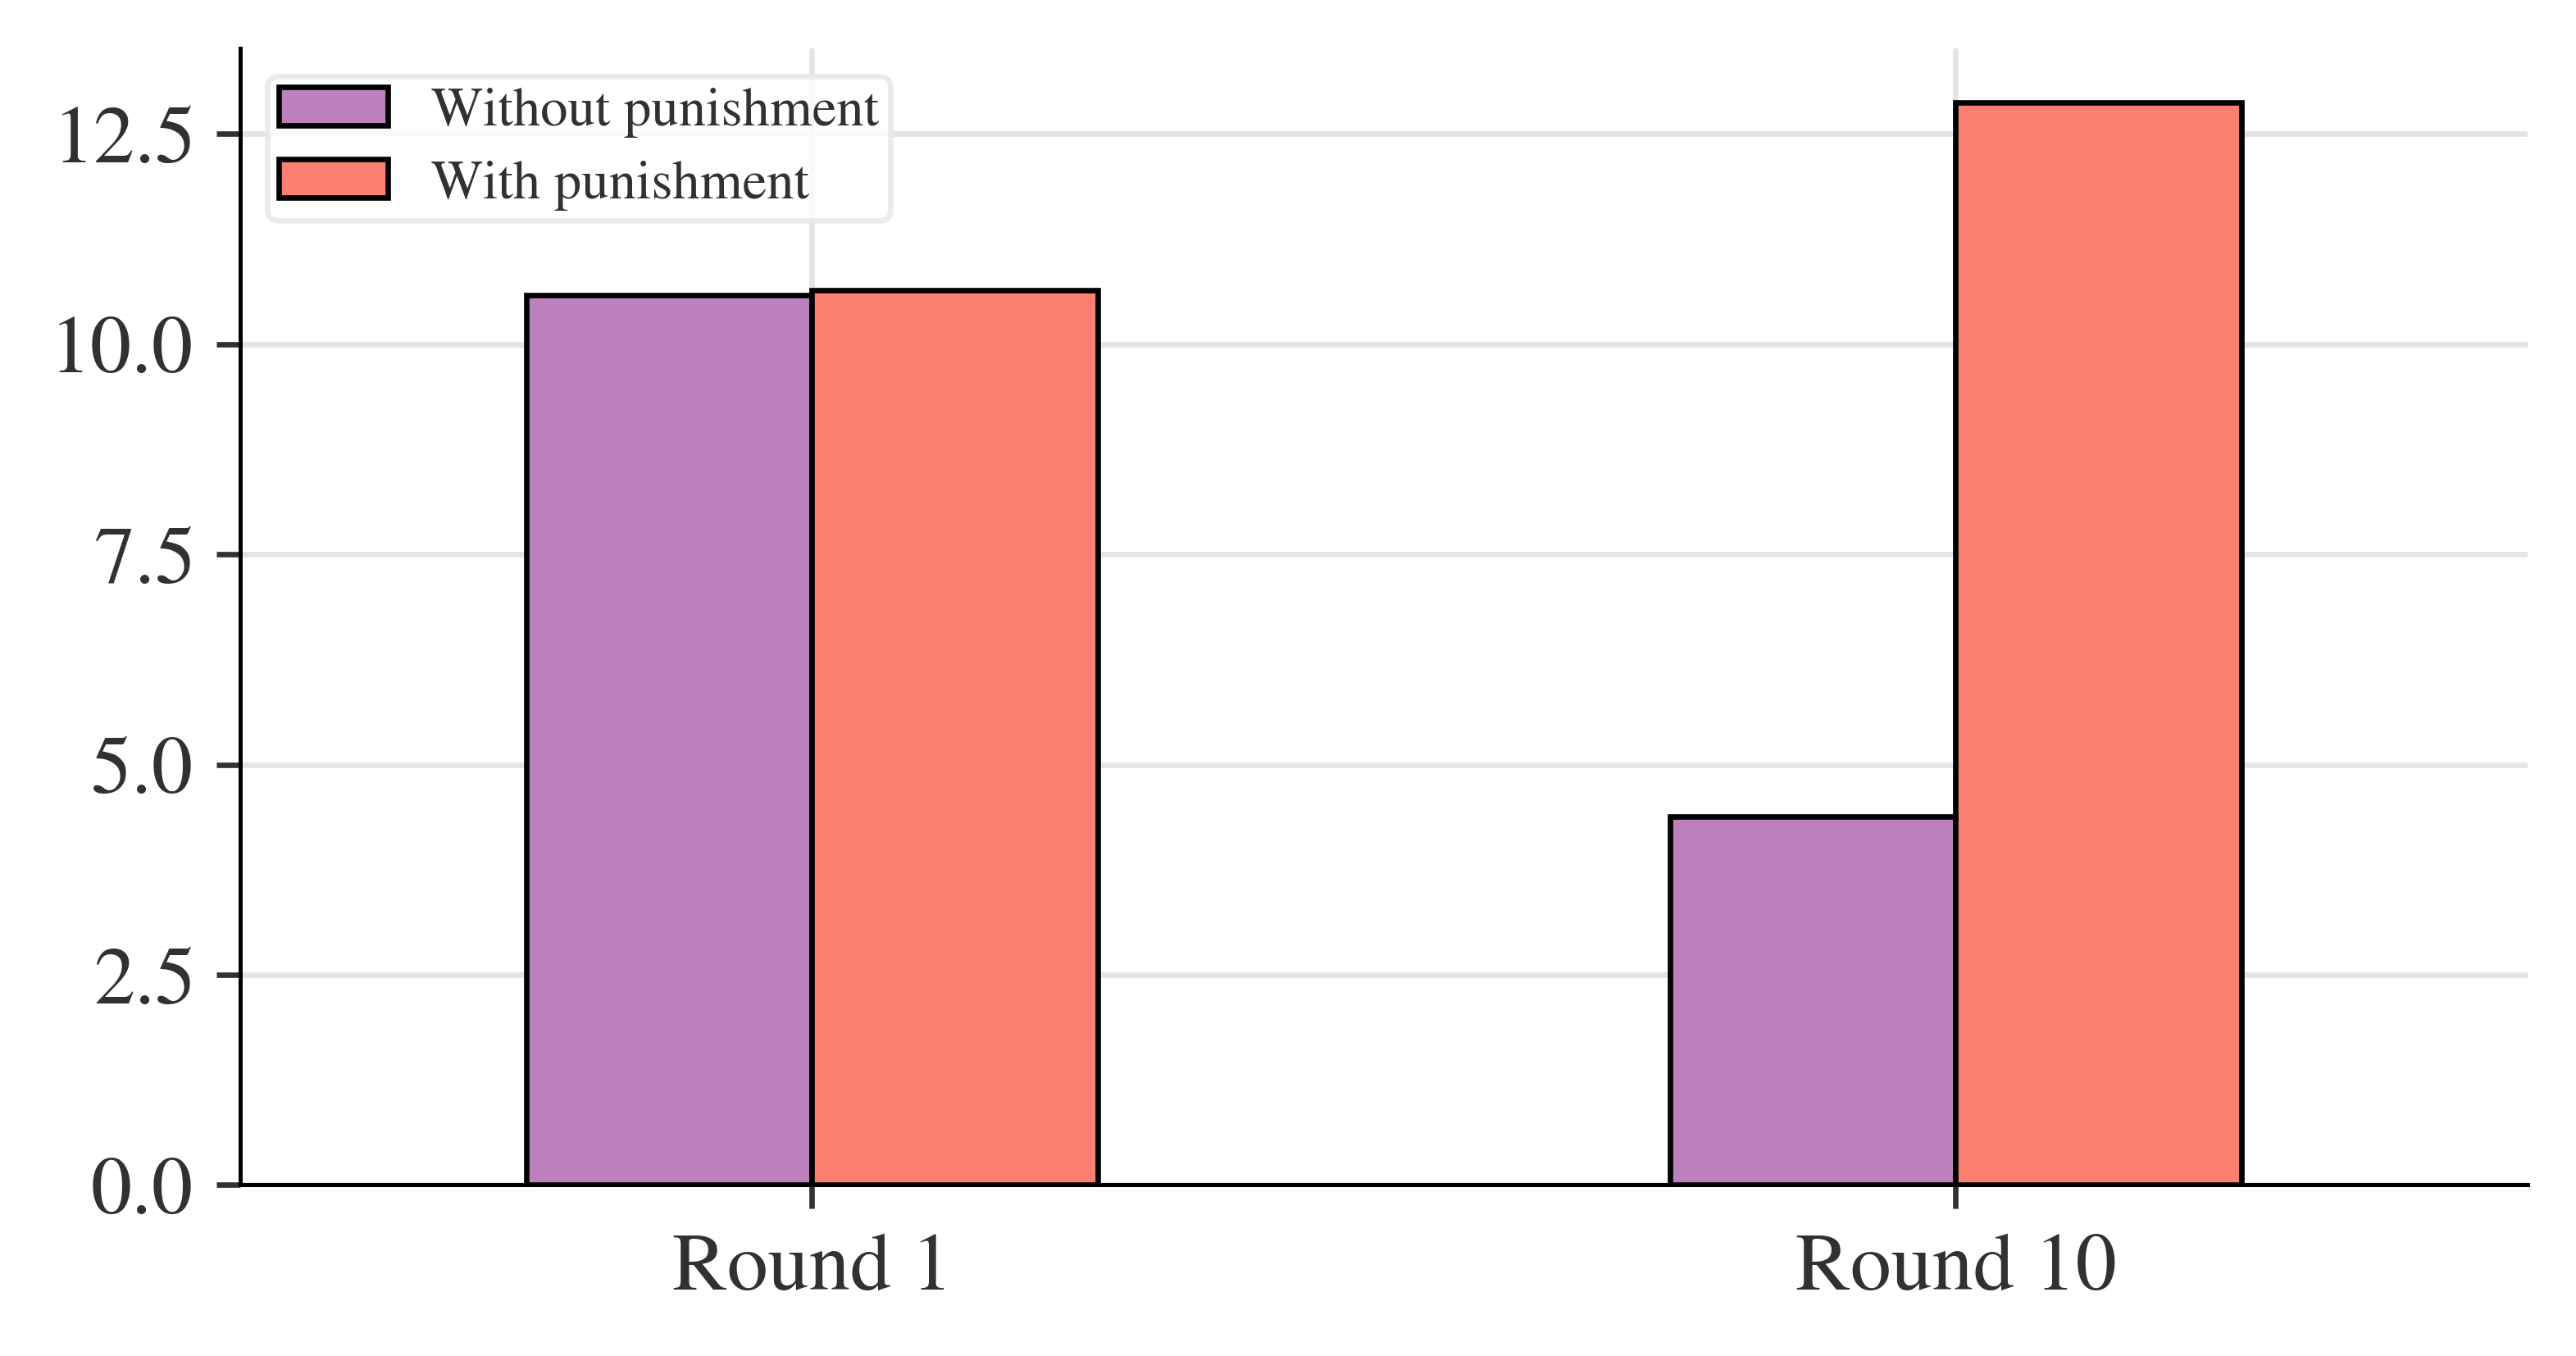
# Create new dataframe with bars incompare_grps = pd.DataFrame( [mean_n_c.loc[[1, 10]], mean_p_c.loc[[1, 10]]], index=["Without punishment", "With punishment"],)# Rename columns to have 'round' in themcompare_grps.columns = ["Round "+str(i) for i in compare_grps.columns]# Swap the column and index variables around with the transpose function, ready for plotting (.T is transpose)compare_grps = compare_grps.T# Make a bar chartcompare_grps.plot.bar(rot=0)
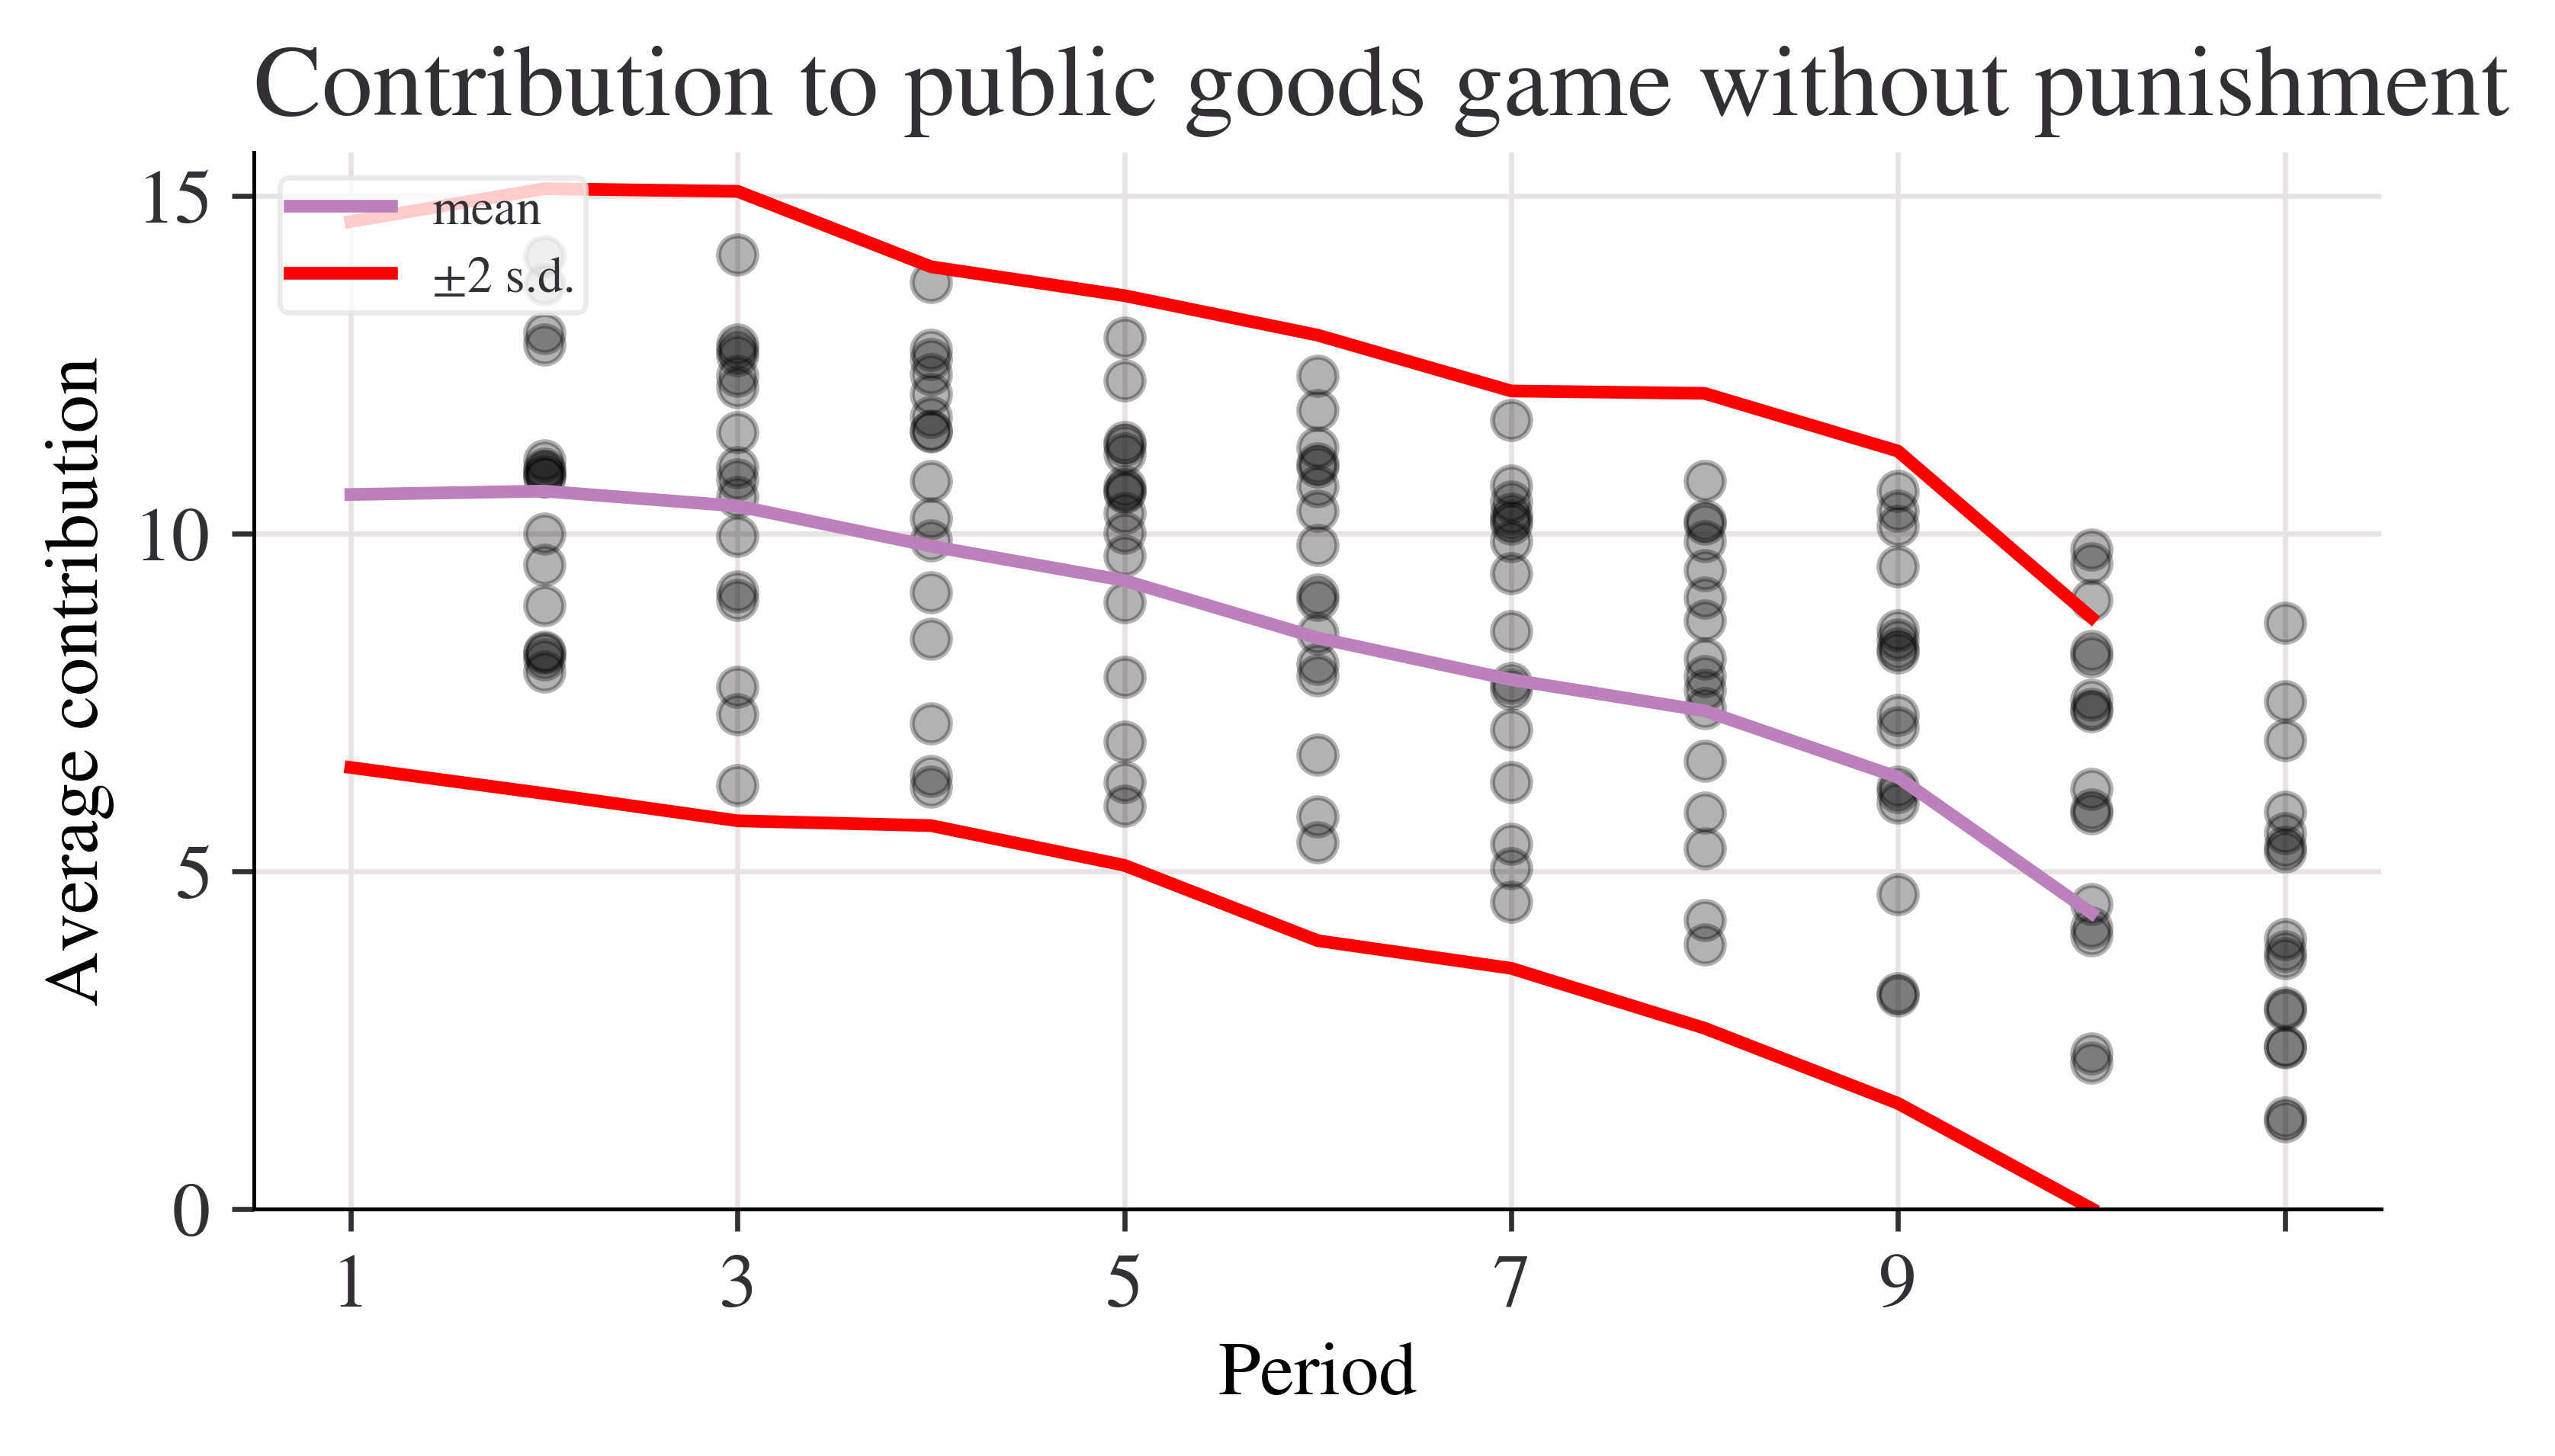
n_c = data_n.agg(["std", "var", "mean"], 1)n_c
std
var
mean
Period
1
2.020724
4.083325
10.578313
2
2.238129
5.009220
10.628398
3
2.329569
5.426891
10.407079
4
2.068213
4.277504
9.813033
5
2.108329
4.445049
9.305433
6
2.240881
5.021549
8.454844
7
2.136614
4.565117
7.837568
8
2.349442
5.519880
7.376388
9
2.413845
5.826645
6.392985
10
2.187126
4.783520
4.383769
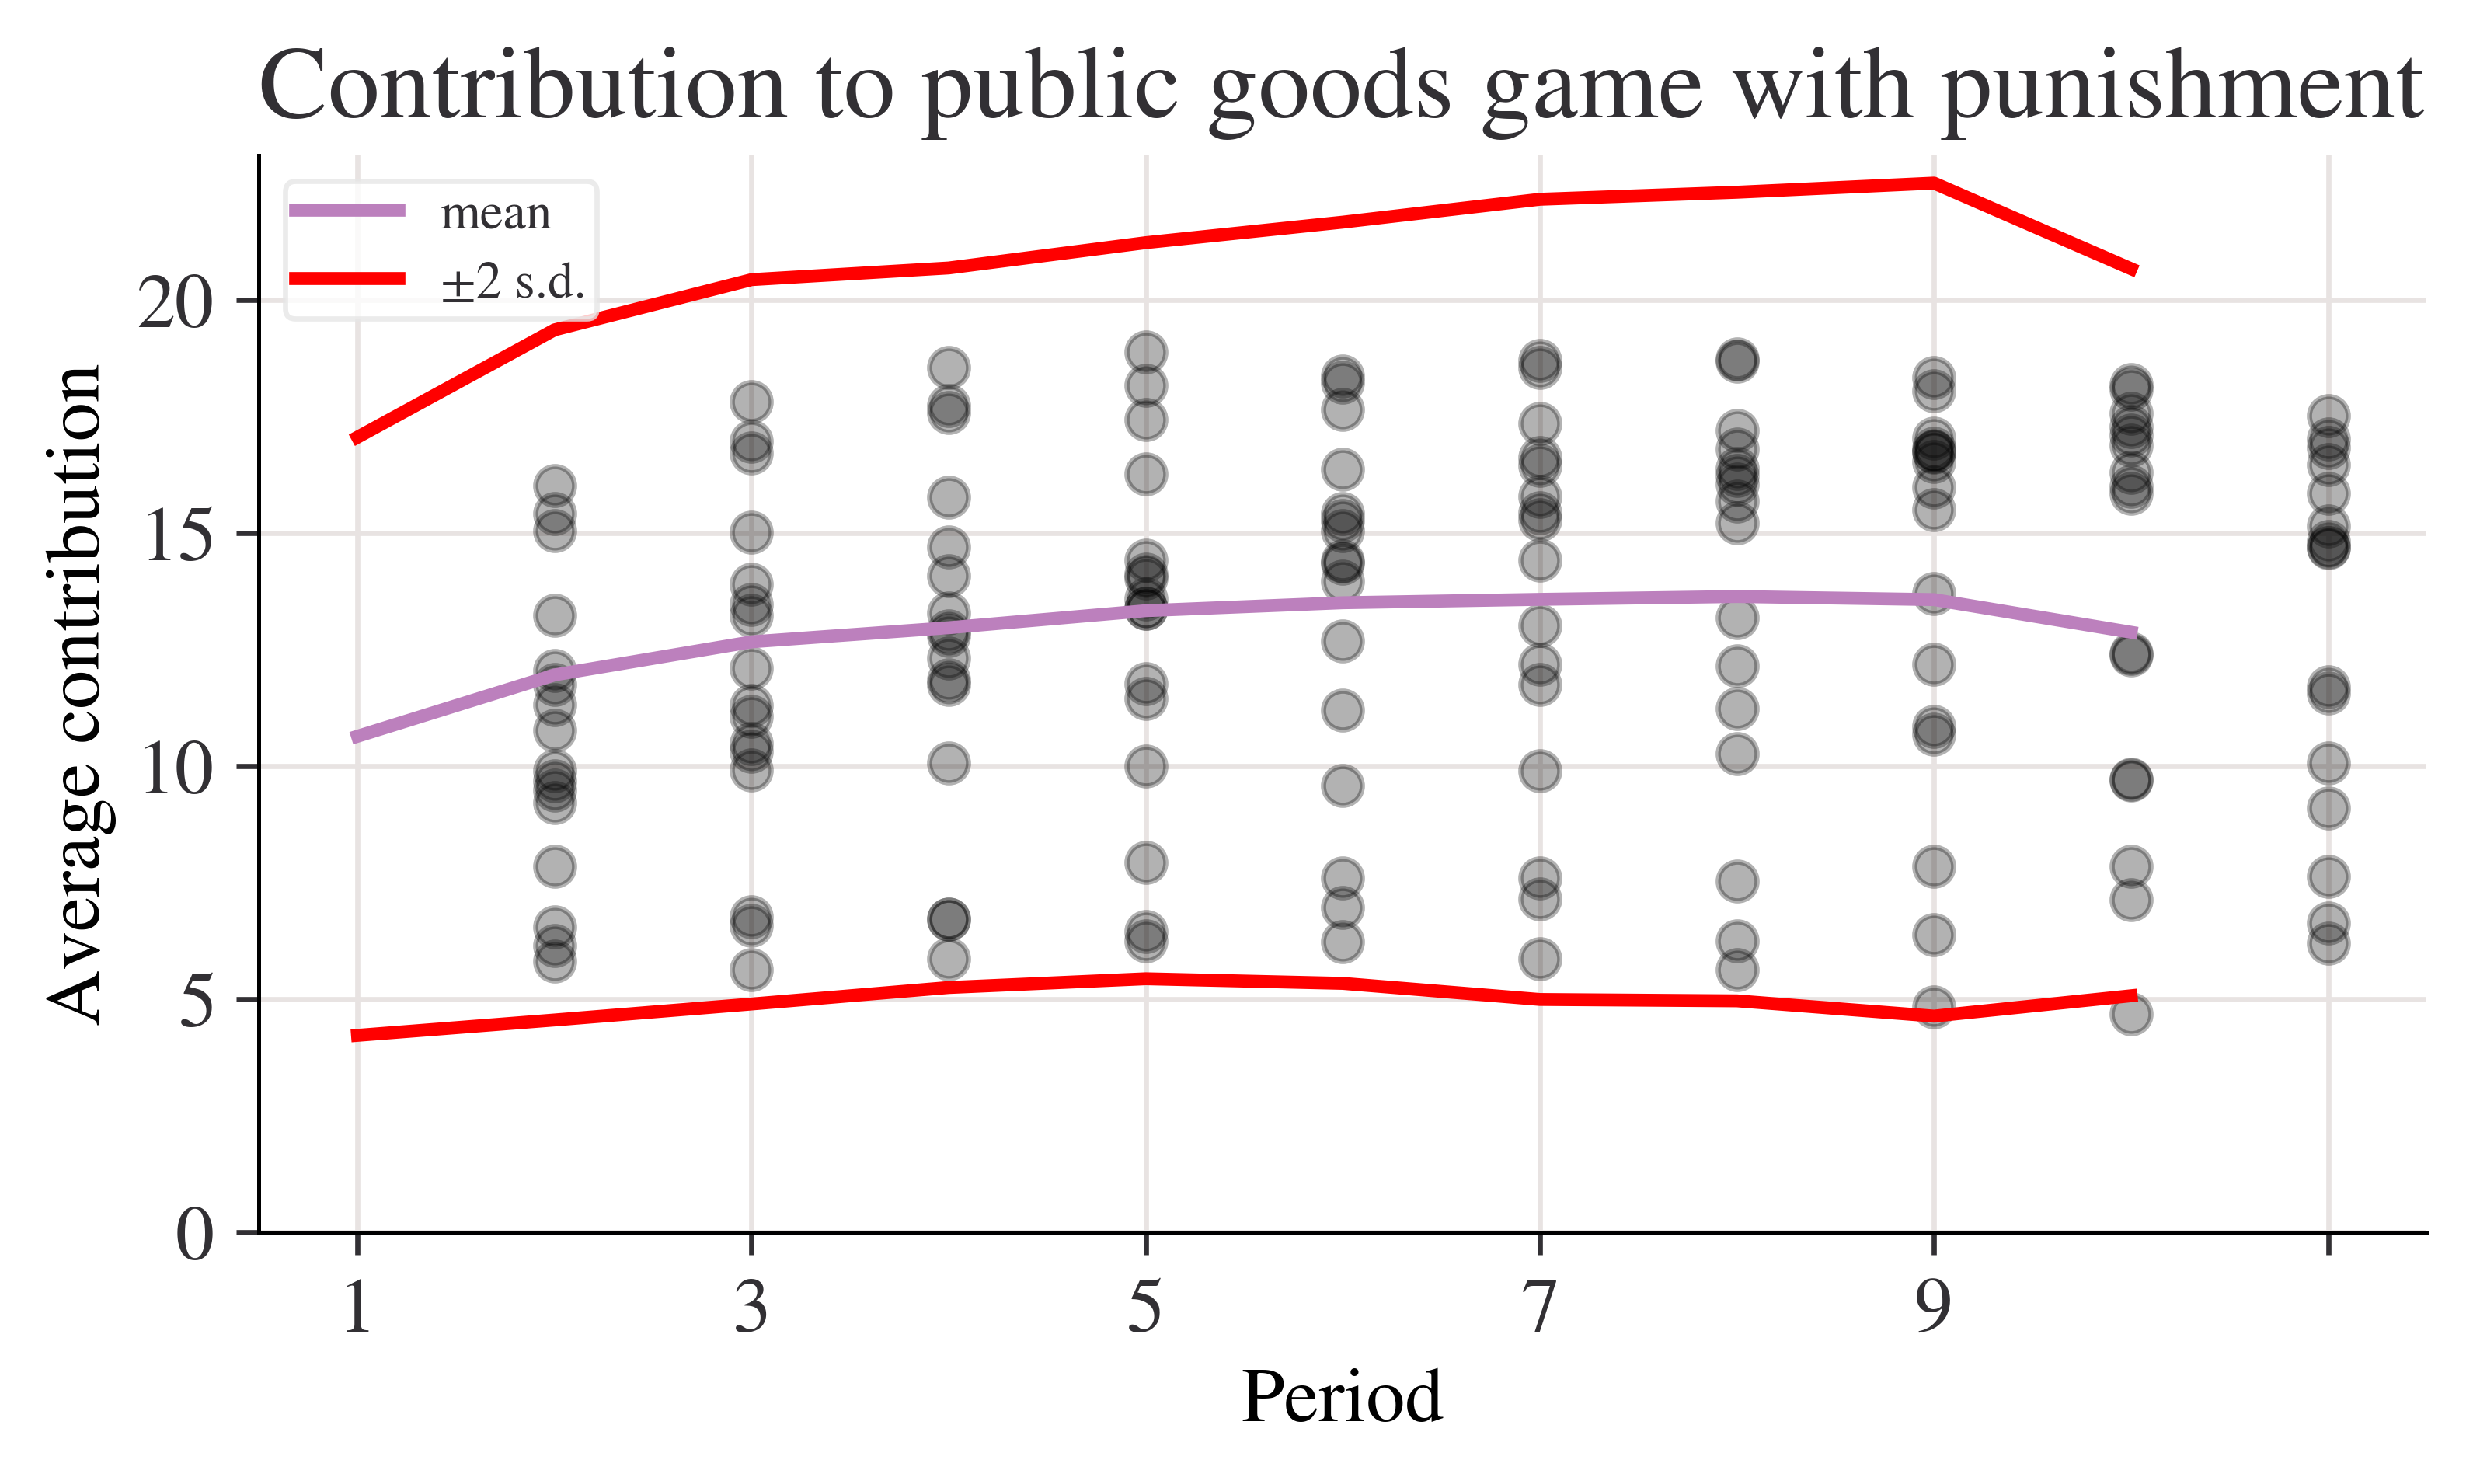
p_c = data_p.agg(["std", "var", "mean"], 1)
fig, ax = plt.subplots()n_c["mean"].plot(ax=ax, label="mean")# mean + 2 standard deviations(n_c["mean"] +2* n_c["std"]).plot(ax=ax, ylim=(0, None), color="red", label="±2 s.d.")# mean - 2 standard deviations(n_c["mean"] -2* n_c["std"]).plot(ax=ax, ylim=(0, None), color="red", label="")for i inrange(len(data_n.columns)): ax.scatter(x=data_n.index, y=data_n.iloc[:, i], color="k", alpha=0.3)ax.legend()ax.set_ylabel("Average contribution")ax.set_title("Contribution to public goods game without punishment")plt.show()
fig, ax = plt.subplots()p_c["mean"].plot(ax=ax, label="mean")# mean + 2 sd(p_c["mean"] +2* p_c["std"]).plot(ax=ax, ylim=(0, None), color="red", label="±2 s.d.")# mean - 2 sd(p_c["mean"] -2* p_c["std"]).plot(ax=ax, ylim=(0, None), color="red", label="")for i inrange(len(data_p.columns)): ax.scatter(x=data_p.index, y=data_p.iloc[:, i], color="k", alpha=0.3)ax.legend()ax.set_ylabel("Average contribution")ax.set_title("Contribution to public goods game with punishment")plt.show()
# A lambda function accepting three inputs, a, b, and c, and calculating the sum of the squarestest_function =lambda a, b, c: a**2+ b**2+ c**2# Now we apply the function by handing over (in parenthesis) the following inputs: a=3, b=4 and c=5test_function(3, 4, 5)
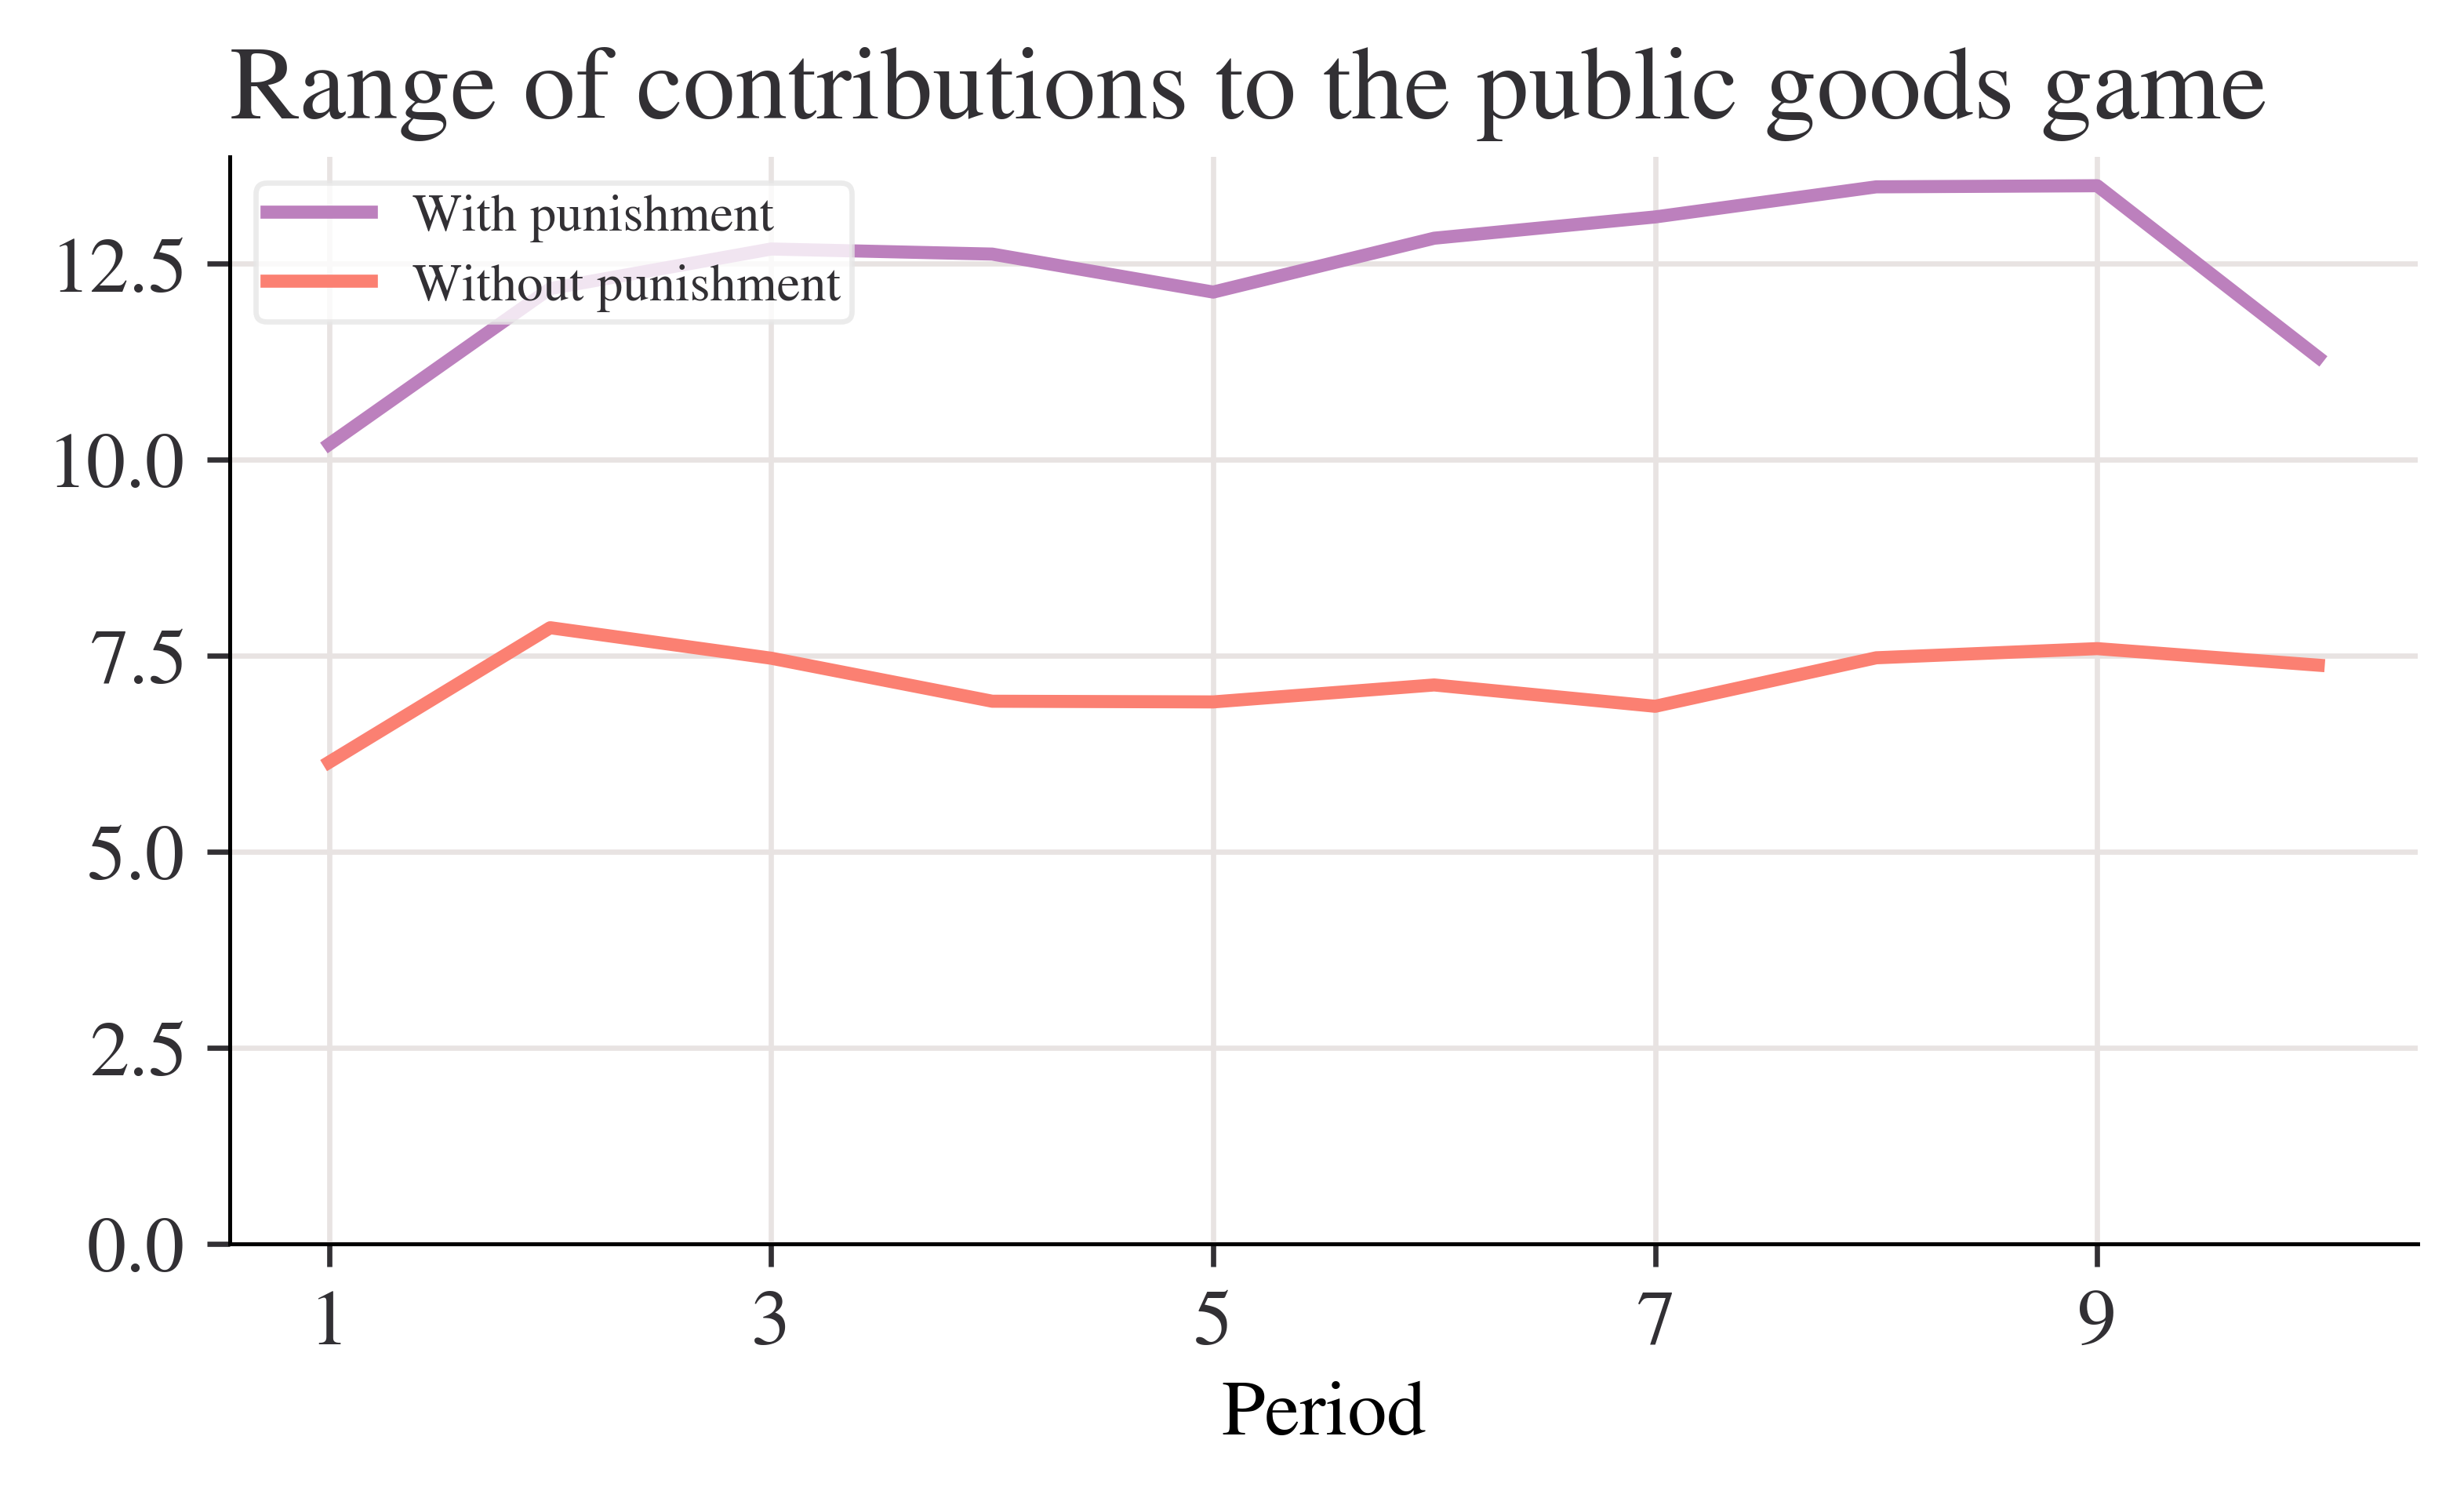
fig, ax = plt.subplots()range_p.plot(ax=ax, label="With punishment")range_n.plot(ax=ax, label="Without punishment")ax.set_ylim(0, None)ax.legend()ax.set_title("Range of contributions to the public goods game")plt.show()