import pandas as pd
import matplotlib.pyplot as plt
import numpy as np

%matplotlib inline03_Visualization -> Scores
Introduction:
This time you will create the data.
Exercise based on Chris Albon work, the credits belong to him.
Step 1. Import the necessary libraries
Step 2. Create the DataFrame that should look like the one below.
raw_data = {'first_name': ['Jason', 'Molly', 'Tina', 'Jake', 'Amy'],
            'last_name': ['Miller', 'Jacobson', 'Ali', 'Milner', 'Cooze'],
            'female': [0, 1, 1, 0, 1],
            'age': [42, 52, 36, 24, 73],
            'preTestScore': [4, 24, 31, 2, 3],
            'postTestScore': [25, 94, 57, 62, 70]}

df = pd.DataFrame(raw_data, columns = ['first_name', 'last_name', 'age', 'female', 'preTestScore', 'postTestScore'])

df| first_name | last_name | age | female | preTestScore | postTestScore | |
|---|---|---|---|---|---|---|
| 0 | Jason | Miller | 42 | 0 | 4 | 25 |
| 1 | Molly | Jacobson | 52 | 1 | 24 | 94 |
| 2 | Tina | Ali | 36 | 1 | 31 | 57 |
| 3 | Jake | Milner | 24 | 0 | 2 | 62 |
| 4 | Amy | Cooze | 73 | 1 | 3 | 70 |
Step 3. Create a Scatterplot of preTestScore and postTestScore, with the size of each point determined by age
Hint: Don’t forget to place the labels
plt.scatter(df.preTestScore, df.postTestScore, s=df.age)

#set labels and titles
plt.title("preTestScore x postTestScore")
plt.xlabel('preTestScore')
plt.ylabel('preTestScore')
Text(0, 0.5, 'preTestScore')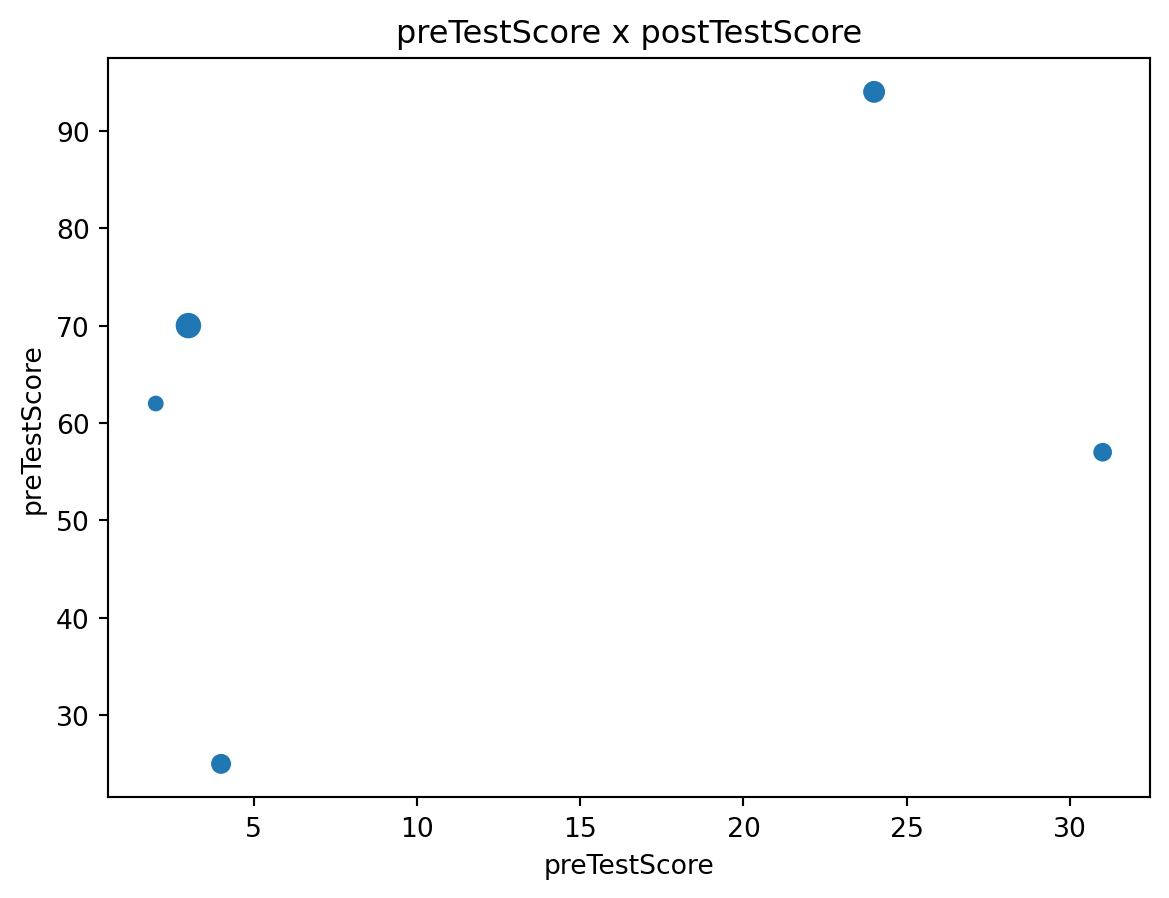
Step 4. Create a Scatterplot of preTestScore and postTestScore.
This time the size should be 4.5 times the postTestScore and the color determined by sex
plt.scatter(df.preTestScore, df.postTestScore, s= df.postTestScore * 4.5, c = df.female)

#set labels and titles
plt.title("preTestScore x postTestScore")
plt.xlabel('preTestScore')
plt.ylabel('preTestScore')
Text(0, 0.5, 'preTestScore')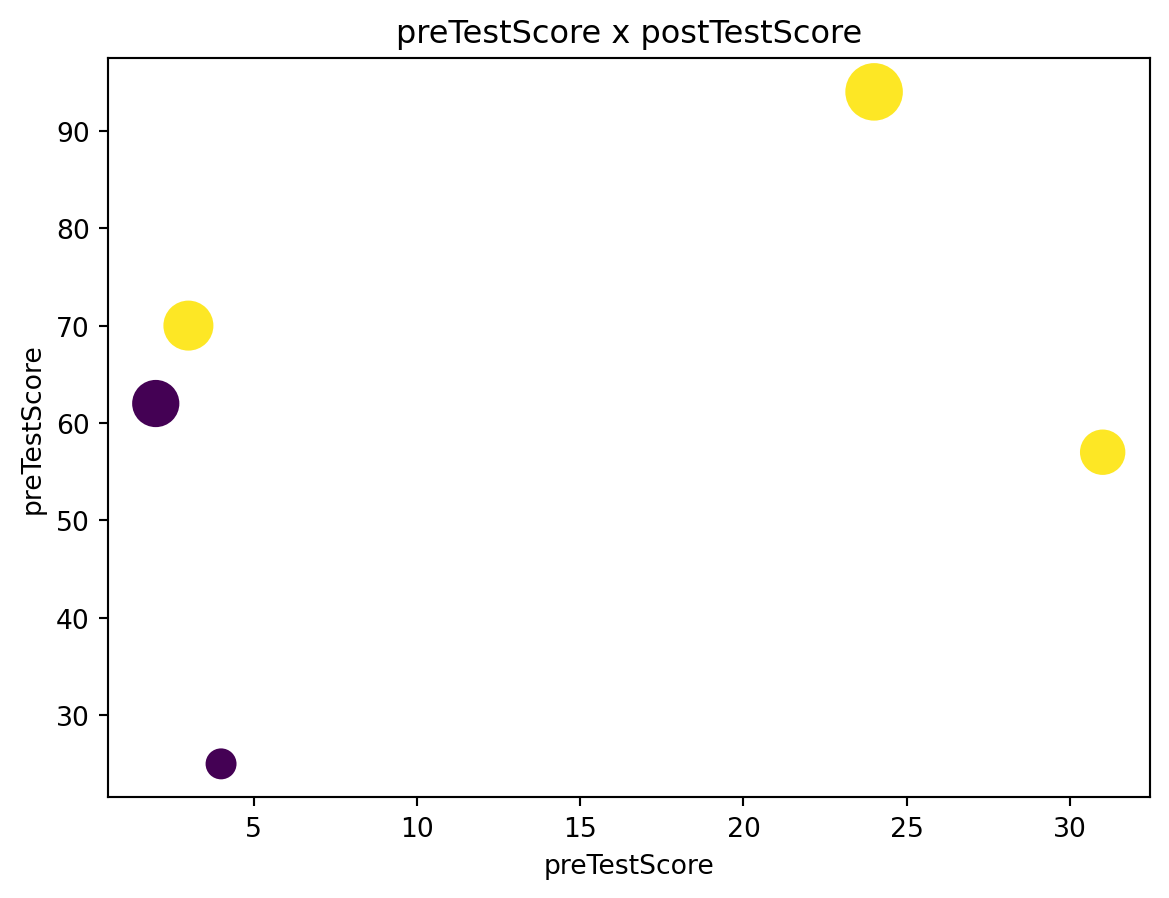
BONUS: Create your own question and answer it.
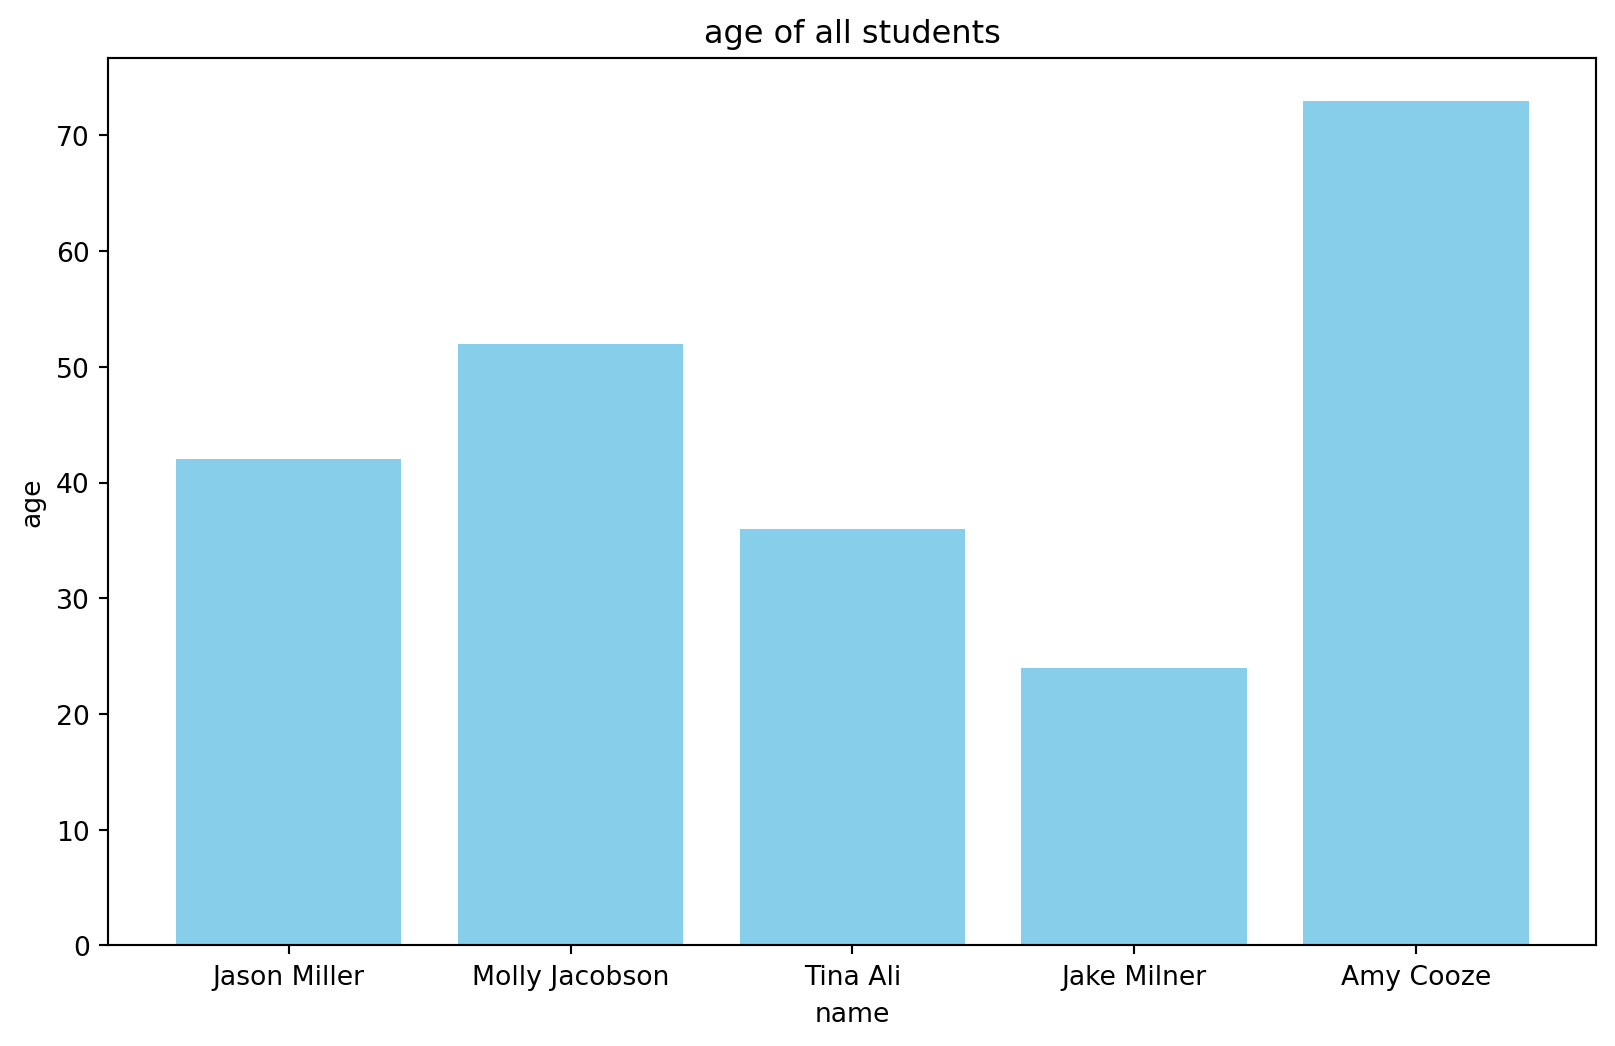
# 问题:柱状图显示所有学生年龄
# Question: The bar chart displays the age of all students

# 回答,answer
# 绘制年龄的柱状图
plt.figure(figsize=(10, 6))
plt.bar(df['first_name'] + ' ' + df['last_name'], df['age'], color='skyblue')
plt.xlabel('name')
plt.ylabel('age')
plt.title('age of all students')
plt.show()